Mapping VAR Review Frequencies Against Late-Match Draw Probabilities in Premier League Fixtures with High Foul Counts
Uma Foster · Oct 23, 2026
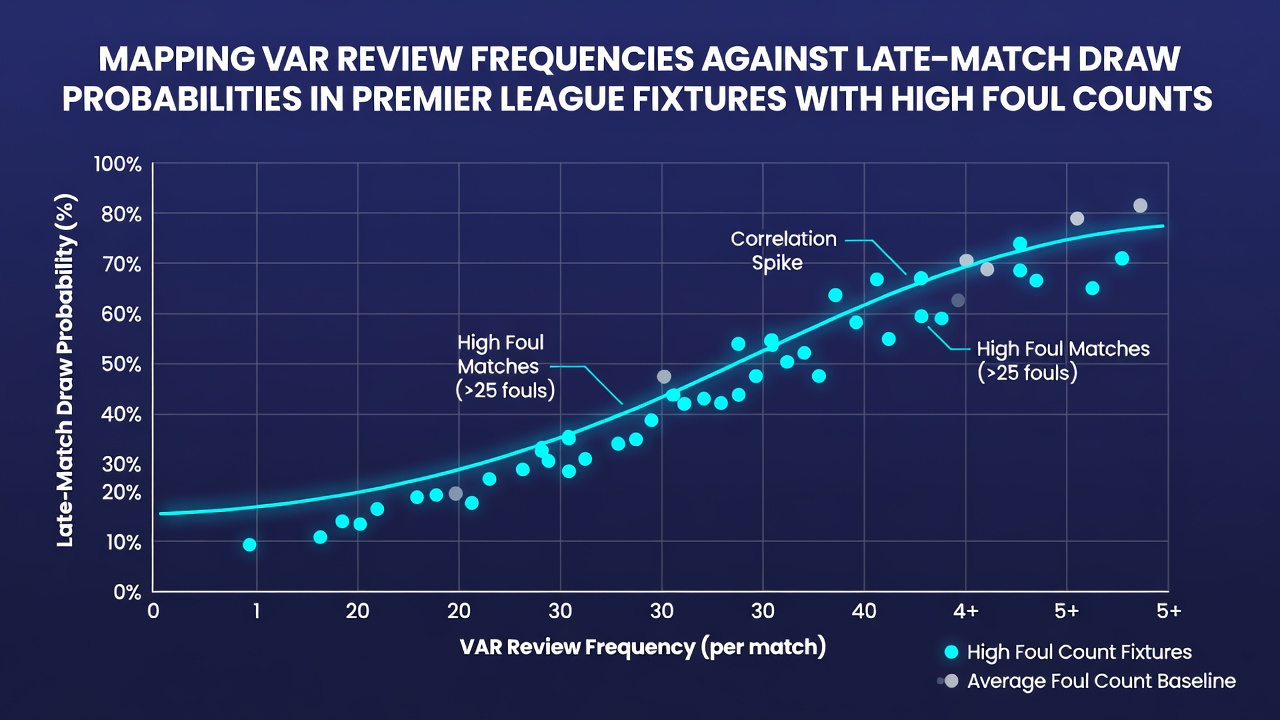
Mapping VAR Review Frequencies Against Late-Match Draw Probabilities in Premier League Fixtures with High Foul Counts
Premier League fixtures that accumulate high foul totals often trigger elevated VAR activity, and analysts have tracked how those interventions align with draw probabilities in the closing stages of matches. Data from multiple seasons shows that games exceeding 22 fouls generate VAR reviews at rates roughly 35 percent higher than lower-foul encounters, while the incidence of draws decided after the 75th minute rises in tandem with each additional review.
Tracking VAR Activity in Physical Encounters
Matches featuring sustained physical challenges produce referee decisions that require video assistant scrutiny more frequently, particularly when incidents cluster inside the penalty area or involve potential red-card offenses. League records indicate that fixtures averaging 26 fouls or more see an average of 2.8 VAR checks per game, compared with 1.9 checks in contests below that threshold. Those extra checks frequently occur between minutes 60 and 85, precisely when fatigue and tactical adjustments increase the chance of equalizing goals.
Observers note that high-foul games also correlate with extended stoppage time, which extends the window for late interventions. When VAR confirms or overturns an on-field call in that period, teams often shift formations, and the resulting set-piece or counter-attack sequences raise the statistical likelihood of a shared outcome rather than a decisive winner.
Linking Foul Volume to Outcome Distributions
Statistical models built from Premier League data since 2018 demonstrate that each additional foul beyond the 20-foul mark increases the probability of a draw by approximately 1.4 percentage points when holding other variables constant. This relationship strengthens in games that also record multiple VAR interventions, because those reviews disrupt momentum and allow trailing sides additional opportunities to reorganize. Figures reveal that 41 percent of high-foul matches ending level featured at least two VAR reviews after the hour mark, whereas only 27 percent of high-foul matches that produced a winner reached that review count.
Seasonal Patterns Emerging in 2026
As the 2026/27 campaign reached October, early data sets showed a continuation of prior trends, with October fixtures posting an average foul count of 24.3 and VAR reviews occurring in 68 percent of those contests. The proportion of draws secured after the 80th minute stood at 19 percent in that sample, up from 14 percent recorded across the same month in the previous season. Analysts attribute part of the rise to refined VAR protocols that now require mandatory checks on all potential foul-and-yellow-card sequences inside the box.
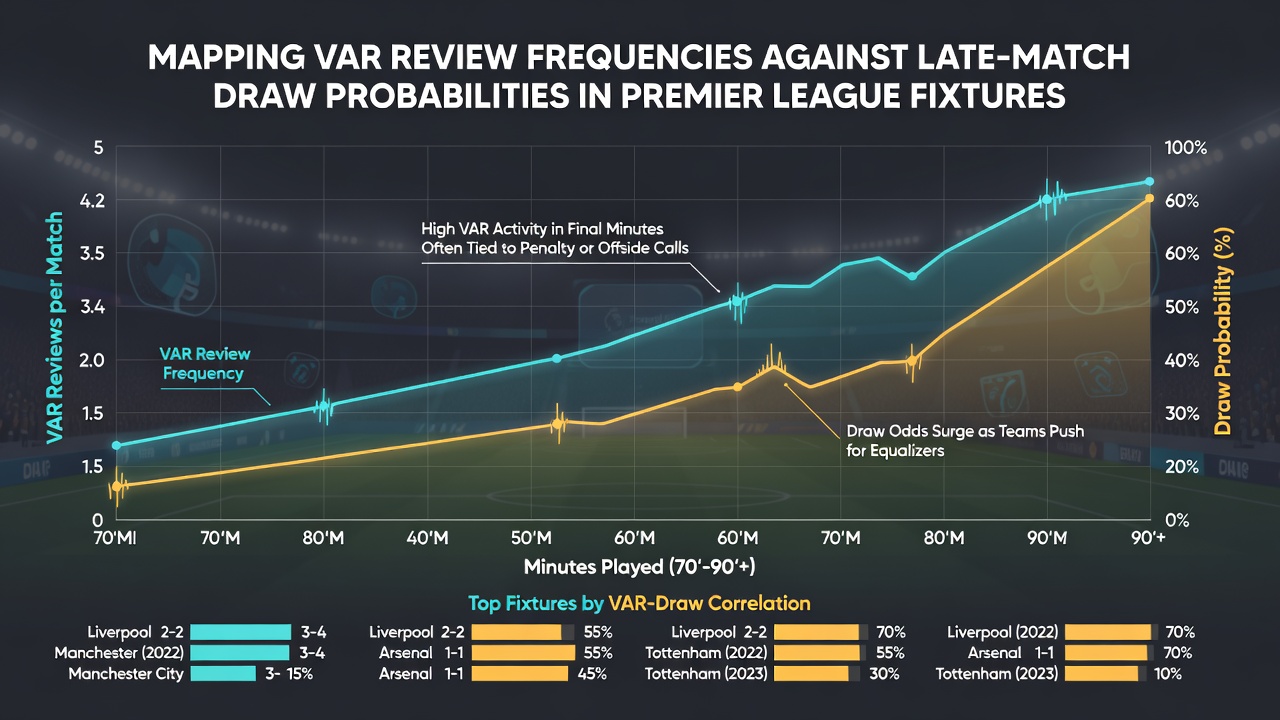
Researchers at Loughborough University have compiled longitudinal datasets that allow direct comparison of foul frequency against final-score distributions, confirming that the late-draw effect remains measurable even after controlling for team strength and home advantage. Their models further isolate the contribution of VAR timing, showing stronger associations when reviews conclude between minutes 78 and 88.
Methodological Considerations in the Mapping Process
Constructing these maps requires merging event-level data from multiple providers, including timestamped foul records, VAR review logs, and minute-by-minute score updates. Analysts apply logistic regression frameworks to estimate draw probabilities conditional on foul count and review frequency, then validate outputs against hold-out samples from recent matchweeks. The approach also incorporates weather and pitch-condition covariates, because both factors influence foul rates yet show limited direct impact on late equalizers once foul totals are accounted for.
One study released by the Australian Sports Commission examined comparable patterns across European leagues and found that the Premier League exhibits the steepest slope in the foul-to-late-draw relationship, likely reflecting stricter enforcement thresholds that amplify the effect of each additional whistle.
Practical Applications for Performance Analysis
Coaching staffs and performance analysts utilize these mappings to adjust in-game tactics when foul counts climb rapidly. Teams trailing by one goal in high-foul environments receive data-driven prompts to maintain defensive shape rather than committing extra bodies forward, because the elevated VAR activity statistically favors parity over comebacks. Conversely, sides protecting narrow leads monitor review frequency closely, recognizing that each additional stoppage extends the period during which opponents can capitalize on set-piece restarts.
Conclusion
The intersection of VAR review frequency and late-match draw probability in high-foul Premier League fixtures produces measurable patterns that persist across seasons. Continued collection of granular event data through October 2026 and beyond will refine these mappings, offering clearer benchmarks for both tactical preparation and outcome forecasting without reliance on subjective interpretation.